


Case Study: Production-Line As-Builts in 4 Days — Manufacturing Plant, Mexico
A Mexico consumer-products plant needed field-verified as-builts before moving a production line. Our team captured it in 4 days and delivered a 3D BIM model.
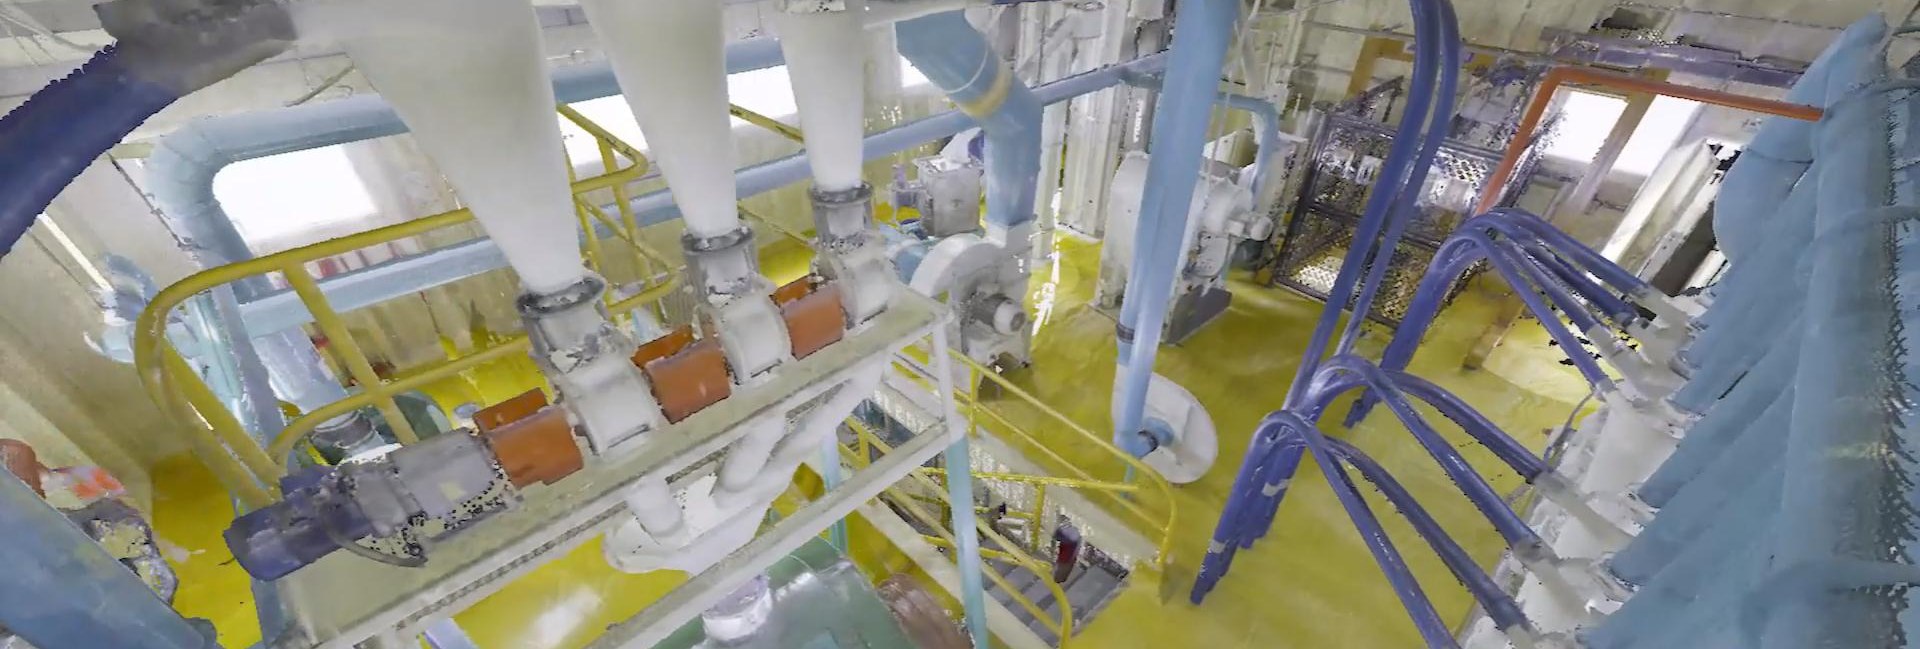
Key takeaways
- A production-line relocation in a live plant started with no reliable drawings of the production area or the electrical substation. The scan replaced estimates with field-verified existing conditions before the area was reconfigured.
- Four days on site and about 450 scan setups with a Leica RTC360 and FARO Focus units produced a registered point cloud and a LOD 300 BIM model.
- Registration was checked against independent total station measurements and documented in a coordinate comparison table.
- Restricted substation access, which required several permits, can now be handled through a 360° tour reviewed from a computer.
- The client reported that it plans to require this documentation for future space reconfiguration projects.
At a glance: 37,674 sq ft captured · 4 days on site · ~450 scan setups · Leica RTC360 + FARO Focus · Deliverables: registered point cloud + LOD 300 3D BIM model.
Project location: Mexico. Executed by our team in Mexico; client name withheld. We include it because the conditions — a live plant, a production line to relocate, no reliable drawings — are typical of brownfield projects anywhere.
The challenge: a line relocation with no reliable drawings
A consumer-products manufacturer in Mexico needed to rehabilitate and relocate a production line, but had no reliable as-built documentation of the existing production area or the electrical substation. In a live, congested plant, manual measurement would have taken weeks and still risked missed conflicts and compounding errors.
The decision on the table was the one every brownfield team faces before moving equipment: know what is actually there, and what surrounds it, before committing budget.
The obstacle: restricted access to the electrical substation
The substation was the hardest part of the site. Access was restricted and several permits had to be requested. That is the case for capturing a space once and completely, rather than re-entering it every time a new question comes up.
The approach: four days, about 450 setups
Our field team deployed terrestrial laser scanners — a Leica RTC360 paired with FARO Focus units, both part of our fleet — chosen for the fraction-of-an-inch precision the client required. Over four days on site, the crew captured the production area and electrical substation in roughly 450 scans (about 9,400 sq ft per day), registered into a single, QA-controlled dataset with minimal disruption to plant operations.
How does a scan compare with manual measurement on a project like this?
| Question | Manual measurement | Laser scan |
|---|---|---|
| What you get | Individual points, joined afterward with lines | Every visible surface in the scene, registered into one dataset |
| Context around the work area | Only what someone thought to measure | Existing equipment, clearances and routing around the work area |
| Field time in a live plant | Weeks, estimated for this plant | 4 days on site |
| Restricted areas, such as the electrical substation | Each new question can mean another visit and another permit request | Captured once; reviewed afterward through the 360° tour |
Speed in the field mattered, but context mattered more. A scan does not return isolated measurements. It returns everything around them, so a clearance, a route or an equipment position can be checked against the real surroundings and not only against the points someone chose to measure.
What was delivered, and how accuracy was checked
- Point cloud. A survey-grade, fully registered point cloud of the production area and electrical substation.
- 3D BIM model. Built from the point cloud and delivered at LOD 300 on this project.
- Registration check. A comparison table contrasting the coordinates in the project coordinate system, the same points in the point cloud, and points measured independently with a total station, from which the deviations were established.
On any project, the LOD and the target tolerance are agreed with your team before mobilization and documented in the deliverable. A deviation report documenting model-to-point-cloud accuracy is available on request.
The outcome
The client gained two things it did not have before: accurate as-built plans, and a 3D base to make precise decisions about the area before reconfiguring it, testing equipment placement, clearances and routing against reality before committing budget. The same documentation now records the existing conditions of the plant for the client's engineering department to use on future work.
The relocation was executed successfully. The client was satisfied and told us it plans to make this type of documentation a requirement for any future space reconfiguration project.
The substation also changes how access works. With the 360° virtual tour, the client's team no longer needs to go through as many permits or lose as much time to reach it; they can move through the space from a computer and take measurements of interest safely, without being there.
From point cloud to decisions — a digital base accurate enough to design from.
The same terrestrial scanning approach also caught a fabrication conflict before it reached the field on a Houston-area project — see the steel reconciliation case study. To see how point clouds become design-ready models, read about Scan-to-CAD/BIM or our existing conditions survey service.
Planning a brownfield project or equipment relocation?
Get a free sample scan of your facility.
Frequently asked questions
What problem did the scan solve before the production line was relocated?
It replaced estimates with field-verified existing conditions of the production area and the electrical substation. Equipment placement, clearances and routing could be tested against reality before the area was reconfigured and before budget was committed.
How long did the field work take, and how disruptive was it?
Four days on site, roughly 450 scan setups at about 9,400 sq ft per day, with minimal disruption to plant operations. Scope and site access move those numbers; a restricted area such as a substation typically adds permitting lead time before the crew can enter.
How was registration accuracy documented?
In a comparison table that contrasts three sets of coordinates: the project coordinate system, the same points in the registered point cloud, and points measured independently with a total station. The deviations were established from that comparison. A deviation report documenting model-to-point-cloud accuracy is available on request.
What level of detail was the BIM model delivered at?
LOD 300 on this project. On any project, the LOD and the target tolerance are agreed with your team before mobilization and documented in the deliverable rather than assumed.
How does a 360-degree tour reduce access to restricted areas?
Once a restricted area has been captured, the client's team can review it from a computer and take measurements of interest without entering the space. That reduces repeat access requests and the permits that come with them.
Why does a Houston-based site show a project in Mexico?
Because the conditions are typical of brownfield work anywhere: a live plant, a production line to relocate, restricted electrical areas and no reliable drawings. The project was executed by our team in Mexico, and the client name is withheld.
Get in Touch for Tailored 3D Laser Scanning & BIM Solutions